- Subject Code : ACC3510
- University : Edith Cowan University My Assignment Services is not sponsored or endorsed by this college or university.
- Subject Name : Auditing
Case Study: Auditing
1.
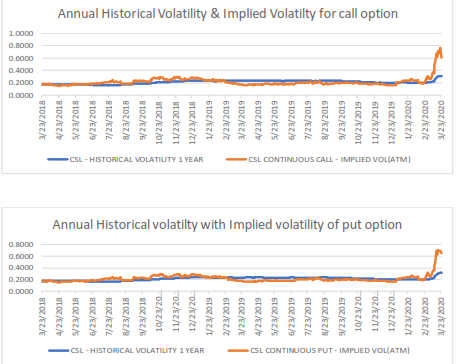
2. As per the above graphs, we see that historical volatility has somewhat been constant over the period and the implied volatility for both the call as well as the put option changed over the period. The implied volatility increased rapidly at the end of the period indicating increase price movement in the future.
In the above graphs we can see the volatility crossover as the volatility for a short period of time spikes over the historical volatility. This indicates that the market expects a drastic change in the price of the stock and there is uncertainty regarding the direction of the price movement.
According to the mean reversion theory, the movement in the value of anything is expected to revolve around its mean. Here, the implied volatility has been near to the historical volatility. We can see only a slight difference in the volatility rates. But as we proceed towards the end of the period, we see the implied volatility shoots up thereby creating a huge difference from the historical volatility. According to the mean reversion theory, the implied volatility would fall down in the future so as to come in line with the historical volatility.
3. A delta neutral strategy is a strategy that hedges the investor from small movements in the price of a security. From the graphs above we see that the historical volatility for CSL is less than its implied volatility and the volatility for CSL is expected to increase in the future. In such a case a good way to potentially profit from such volatility is by creating a delta neutral strategy.
Delta neutral strategy can be created by either keeping the option contract fixed and changing the stock position daily or by keeping the stock position fixed and changing the option position daily. Here, we will create the delta hedging with the second option.
If the investor is holding the underlying security, he should either go short on call option or go long on put option. If the investor has a short position in the underlying security, then he should go long on call options. This will create a delta neutral strategy where the investor will hedge himself from small price movements and can make profits from such change in the price of the security.
So, if the investor has a long position on the underlying security, then he would be afraid of the stock prices falling because then he will incur a loss if the price of the underlying security falls dawn, he will have to sell his holding at a price lower than the purchase price. Hence, the investor should go long on put option as that will hedge him against the fall in the price of the security. Number of options to be purchased is determined by the number of shares bought and the delta of the option as on that date. So, in the end if the stock price falls down, then the investor would incur a loss on the shares but his put option will get exercised and he will incur a profit there, thereby eliminating the loss. And if the stock price increases, he will earn a profit on the shares and his put option will lapse thereby limiting the loss on the option to the amount of the premium paid.
Assume, the investor is holding 10,000 shares of CSL. He bought the shares at the price of 308.97.
Investment in stocks = 10,000 shares* 308.97/share = 30,89,700
Now to protect himself he will go long on put option.
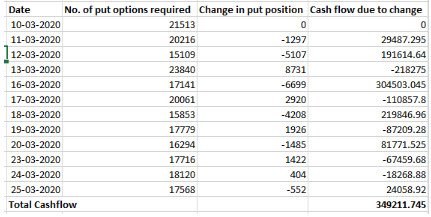
No. of put options to be bought = No. of shares of CSL exposed to/Delta of the put option = 10,000/0.4648 = 21,513 options
Premium on put option paid = 21,513 options* 21.685 = 4,66,509.41
Position as on day1: Long on 10,000 stocks
Long on 21,513 put options
Day 2: The delta of put option changes to 0.4947
Hence, number of put options to be held = 10,000/0.4947 = 20,216 options
Number of options already held = 21,513
Sell put options = 21,513-20,216 = 1,297 options at the rate of 22.74 per option
This will give as an inflow of 1,297 options* 22.74 per option = 29,493.78
4. So, by rebalancing for the period, in the end we will have:
10,000 shares of CSL bought @ 308.97
17,568 long put options with strike price of 308
Total cash flow due to rebalancing during the period = 3,49,211.7
Now, in the end of the period, i.e. on 25-03-2020 the stock price turns out to be 284.36
Therefore, loss on stock = 10,000* (308.97-284.36) = 2,46,100
Since, the spot price is below the strike price, put option will be exercised.
Hence inflow from put option = 17,568* (308-284.36) = 4,15,307.52
Net cash flow at the end of the period = profit/(loss) from shares- Premium on put option paid+ cash flow from rebalancing+ profit from exercising put option
= (2,46,100)- 4,66,509 + 3,49,211.7 + 4,15,307.52 = 51,910.22
Therefore, even after the fall in the share price, the investor earned a profit of 51,910.22. Hence, this delta neutral strategy worked for the investor and hedged him against the fall in the stock price.
Now suppose, if the price of the stock would have gone up to 325 per share.
Then, Net cash flow at the end of the period = profit/(loss) from shares- Premium on put option paid+ cash flow from rebalancing+ profit from exercising put option
= 10,000 shares* (325-308.97)-4,66,509+3,49,211.7+0 = 43,002.70
Hence, proved even if the price of the share increases, the investor would earn a profit from the transaction.
Remember, at the center of any academic work, lies clarity and evidence. Should you need further assistance, do look up to our Auditing Assignment Help
Get It Done! Today
1,212,718Orders
4.9/5Rating
5,063Experts

Highlights
- 21 Step Quality Check
- 2000+ Ph.D Experts
- Live Expert Sessions
- Dedicated App
- Earn while you Learn with us
- Confidentiality Agreement
- Money Back Guarantee
- Customer Feedback
Just Pay for your Assignment
Turnitin Report
$10.00Proofreading and Editing
$9.00Per PageConsultation with Expert
$35.00Per HourLive Session 1-on-1
$40.00Per 30 min.Quality Check
$25.00Total
Free- Let's Start


