- University : Regenesys My Assignment Services is not sponsored or endorsed by this college or university.
- Subject Name : Economics
Introduction
In then given questions below the basics of economics are explained in a precise and concise manner. These questions will help in grasping the basic knowledge which is required to understand such a vast subject which important for every country. With demand and supply it will enable the readers to get an idea of how the economy is entirely dependent on both these terms to be effectively in equilibrium. With the basics of econometrics it is supporting the readers in a manner by which will help in data forecasting and analyzing. In addition to this, the best part about this assessment is it is enabling the readers to get a better knowledge of the current economic scenario and status of the country of South Africa.
Q.1.
1. According to this assignment we may understand that South Africa amongst those countries in the developing world’s that has suffered labor related challenges and also trying to stabilize the economic development as these challenges are being addressed in different ways by the government, local organizations and other international non-governmental organizations. When it comes to the characteristics, your points shall revolve around the market having trade policies, having macro-economic approaches, high demand and growth of labor, job creation aspects, institutional development for labor markets, labor gaps and so on (Nicoli, 1998), hence some of the traits to take note of.
When it comes to the challenges facing labor markets in South Africa, it is significant to take note of a number of them which include unemployment, labor insufficiency, poor policies, lack of political will and support, governance issues (Nicoli, 1998). Furthermore, it is also critically realized that the shortage in skilled labor availability also creates a gap in labor supply in the South Africa's market hence another problem to look at and take note of as well (Mosomi and Wittenberg, 2020). Therefore, these are some of the points you can as well consider when developing your response towards this assignment, use the sources below for more examples and information.
In a general perspective, understand that South Africa has a positive economic growth trajectory that has been maintained since 2003 and this started losing focus in 2008, this was as a result of world financial crises just as other world economies are usually affected in terms of fluctuations and changes in the currencies as well. This led to problems examples such as the unemployment meaning the rates of employment really went down as a result. Also the policies are not that sound and effective, for example the minimum wage policy tends to raise the wages at the top this has caused a stunted growth for the wages in the middle class, hence some of the crises challenges to take note of.
2. There is an inverse relationship between the rate of inflation and the unemployment rate- the given statement is true. This can be illustrated by a Phillips Curve. It shows that there lies opposite association between the inflation and rate of unemployment. The Phillips curve in a short run situation is not linear in nature but is in the shape of an “L”. In the Phillips curve, inflation and unemployment are taken on the y and x-axis respectively in the graph (Jhinghan, 2016: 192).
Whereas, taking into consideration the Phillips curve in a long run situation, is a vertical line with inflation and unemployment in the y and x-axis respectively in the graph. In the long run Phillips curve assumes that at the employment level of nature, employment and inflation are not related to each other.
3. Trade unions can increase the minimum wage rate are by a number of ways such as: (Jhinghan, 2016: 356)
-
With the help of collective bargaining- trade unions can use collective bargaining as tool to increase the minimum wage rate for their employees. This can be done through engaging in dialogue with employers on wage increment. Example when inflation hits a country real wage of workers declines and through this trade unions can chip in to negotiate how best they can make the wages increase of employees.
-
Making workers more productive- trade unions can give training and advice to workers which in turn can motivate them to be more productive which will result to more profit to the employers and thus employers give raised remuneration to laborers.
-
Restriction of labor supply- by restricting new participants to enter into the profession this will prevent an increase in supply of labor and when there is a fall in supply of l wage rate of labor can increase.
-
The institution of a legal minimum wage- government can implement legal minimum wage rates endorsed by the trade unions which make it illegal for an employer to hire and pay an employee below the set amount and by this minimum wage rate is minimized.
4. The relationship between labor supply and that of elasticity in South Africa’s public sector with the help of the education system. Supply elasticity is increased through education driven initiatives. Expressed in an unexpected way, training driven activities are utilized to build factors that will, thus, increment supply elasticity (Hendriks, 2016). This merits
emphasizing: the point of supply expanding training tasks ought not be to diminish the quantifiable abilities lack (contrast among gracefully and request at the current normal pay level) to zero, as a little yearly deficiency demonstrates a sound year-on-year development popular - a pointer of industry development. The inelastic flexibly bend gives a circumstance where for a given compensation, the alumni are not a lot of ready to convey their work and the reasonably versatile elastic supply curve shows a specific increment in the supply of labor, with an expansion in compensation (Jhinghan, 2016: 94).
Q.2.
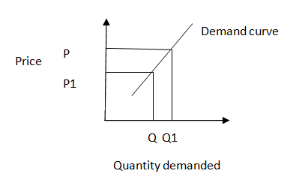
Yes, it is possible to get an upward sloping demand curve in certain cases such as:
-
Giffen goods: According to giffen’s paradox, these are those goods on which the consumer spends a large part of their income and the demand for which falls with the price (Nicholson and Synder, 2014: 90). For example: in case of millets which is an inferior item and is used by only those who have a limited income and they cannot afford to buy superior goods. As soon as the income of such people increases their demand shifts from such goods to superior goods. Thus, demand curve in this case is upward sloping.
-
Emergencies: Law of demand may not hold during emergencies like war or natural calamities (Agarwal, 2018). At such times consumer behave in an abnormal way, If they expect shortage of goods, then they have the tendency to buy more, hoard the goods so as so to avoid problem in future. On the other hand, during depression in spite of fall in prices people buy less and save more so as to be able to face future uncertainties.
-
Articles of Snob Appeal: `The law of demand does not apply to the consumer which serves as status symbol, increases social prestige etc. Veblen has termed these goods as “conspicuous consumption” (Anderton, 2009: 82). Mostly it happens in case of diamonds which are purchased even if the price increases because any future increase in price of diamonds makes possession of diamonds more prestigious.
-
Quality Price relationship: Sometimes consumers assume that high priced goods are better quality than the low priced goods. Such consumers consider price as an index of quality. In such cases more goods are demanded at higher prices and lesser goods are demanded at lower prices (Tisdell and Hartley, 2008: 92). This happens in case of branded products and goods.
For the above describes cases the demand curve is like the curve shown below where with the increase in price quantity demanded for goods increases.
Q.3.
1. No, the entire indifference curve shown will not give the same amount of utility. The reason being indifference curve is based on the assumptions and beliefs that higher the indifference curve higher is the level of satisfaction and utility (Lokanathan, 2018: 142). So, all the IC’s depicted in the diagram show different levels of satisfaction and utility to the consumers. In the given case, I3 is the indifference curve with maximum level of satisfaction.
2. The line B1 represents the consumer’s budget line. A budget line shows various combinations of two products which can be bought with a given budget at given rates of two goods (Tucker, 2008: 158). It is a negatively sloping line because consumer wants to purchase more of one commodity then he has to sacrifice some amount of other commodity. The slope of budget line depends on the prices of two commodities.
3. I1indifference curve is attainable for the consumer but it will not give the consumer the highest amount of satisfaction as it the lowest indifference curve. I2 indifference curve will give the maximum satisfaction as it is tangent to the line B1 which is the budget line of the consumer at point O as shown in the diagram. I3 indifference curve will give the highest amount of satisfaction but will it is not attainable for the consumer as it is out of its income reach with the given income. In the present scenario the budget of the consumer is the budget line.
Q.4.
Current economic scenario of South Africa is as follows:
· Real national income in 2020 is projected to rise 1.1% and 1.8% in 2021 due to domestic and global slowdown but now this also seems vague due to the current pandemic the world is facing of Covid-19.
-
Contraction in agriculture and mining.
-
Erratic weather
-
Electricity shortage (Axford, 2015)
-
Unemployment
-
As the global economy is moving towards recession which impacts every country's economy.
In order to curb all the above crisis the govt. should apply an Expansionary fiscal policy as it will make the flow of funds more effectively to the hands of the general public(Hendriks, 2016) and its impact are as follows:
-
Expansionary financial approach: Fiscal strategy includes use strategy and tax assessment strategy of the govt. The point of the monetary strategy is to build total interest.
-
The first apparatus of expansionary monetary arrangement is to build consumption that is siphoning more cash in the framework that gives a fillip to the interest. During the time of inadequacy popular, the govt. should itself make huge interests in broad daylight works like wellbeing administrations, give free instruction, dispatch business plans for jobless individuals, development of street, railroads and use innovation in horticulture area. The point is to give more cash in the possession of individuals with the goal that they can spend more (Masaba, 2019).
-
Taxes on close to home pay and corporate wages ought to be diminished to energize private utilization and speculation. Assessment on lower pay bunches is canceled. This will build their discretionary cash flow for spending. Moreover appropriations, mature age benefits, joblessness recompense and awards ought to be given. Motivations like intrigue free advances, portion plans and so forth ought to be provided to shoppers so as to help total interest.
-
Govt. getting from open ought to be disheartened in order to expand total interest.
Q.5.
1. a) Total net interest in South Africa in the given year and GDP for that year is certain in light of the fact that Higher the net interest in South Africa higher the GDP.
GDP= Household Consumption+ Government Domestic Private investment + Government spending + Net exports (Jhinghan, 2015: 28)
So, higher the investment higher will be the GDP.
b) Relationship between real rate interest and investment is Negative.
Higher the real rate interests lower will be the investment because people will more tend to save than consumption which ultimately reduces the investment hence they are negative relative.
Real rate = nominal rate - inflation rate (Croushore, 2008: 163)
The interest rate is opportunity cost for investment. So they do not move in same direction hence negative relation between them.
2. They change because they show the effect of independent variable on dependent variable. Coefficient of a regression equation shows the pattern of change in dependent variable due to change in the independent variable associated with the coefficient. Moreover the coefficients are constructed depending on different data sets.
To be very specific, since different coefficient measures the effect of change in dependent variable due to change in independent variables, hence the effects will surely differ from one another (Liberto, 2019).
Let’s take an example, suppose we have a regression equation showing income changes due to change in education and age.
Y = a1education - a2age
Here we have two coefficients a1 & a2, one is the coefficient of education and the other is the coefficient of age. Both are having different sign. Since if education increases income will increase and vice versa, the coefficient have positive sign. As increase in age will decrease income, and vice versa, the coefficients have negative sign.
Now the way age is affecting income cannot be matched the way education is affecting it. Hence the coefficients are not same.
3. The equation Y = 2 + 3x1 + 4x2 represents a linear regression model. Where, Y represents the dependent variable on the terms present on the right hand side of the equation. 2 represents the stochastic error term (Gujarati and Porter, 2017: 25). 3 depict the slope coefficient of a change in Y due to X1. 4 lastly represent the slope coefficient of a change in Y due to X2.
4. Though regression analysis has been widely used in statistical analysis it is not the ideal method for all causal relationships. Since, this method works on an assumption that there exits a linear relationship between every variable under analysis. An example will be an analysis between age and financial independence. Young adults will be stronger financially, at some point it levels of the as they get aged, the independence declines hence a curve, statistical information built on regression will misrepresent such important information (Gujarati and Porter, 2017: 19).
The presence of outliers can easily lead to a skewed conclusion in findings. Regression analysis is also too sensitive to outliers. Since the model capitalizes on means in computation of information thus failing to provide useful information on extremes that could be desired (Estela, n.d).
Conclusion
With the above done analysis on the questions it has enabled a huge understanding on the basic concepts of economics and how the economy will be functioning with the forces of demand and supply in order to get stabilized in equilibrium. The questions also enable in comprehending the fundamentals of econometric forecasting of data by making the readers understand about OLS estimates in a brief manner. In addition to this, it is also helping in giving a brief picture of the micro and macro-economic variables involved in the functioning of the South African economy. It reviewed deeply on the measures which ought to be taken to improve the economic condition of the country.
References
Agarwal, P. (2018, January 20). Exceptions to the law of demand. Intelligent Economist. https://www.intelligenteconomist.com/exceptions-to-the-law-of-demand/ (accessed 25 July 2020).
Anderton, A. 2009. Economics- A level student book, New Delhi: Pearson Longman.
Axford, H. (2015). Should Eskom still hold monopoly over South Africa’s electricity supply? Compare Guru.co.za. https://compareguru.co.za/news/should-eskom-still-hold-monopoly-over-south-africas-electricitysupply (accessed 25 July 2020).
Croushore, D. 2008. Money and banking- A policy oriented approach, New York: Cengage Learning.
Estela, M. (nd). Graphing a line using the slope and y-intercept. Chilimath. https://www.chilimath.com/lessons/intermediate-algebra/graph-a-line-using-slope-and-y-intercept/ (accessed 25 July 2020).
Gujarati, D.N and Porter, C.D. 2017. Basic econometrics, Boston: Mc-Graw Hill.
Hendriks, J.F. (2016). Critical evaluation of possible policy options to reduce unemployment in South Africa [Unpublished master’s dissertation]. University of the Western Cape. http://etd.uwc.ac.za/xmlui/bitstream/handle/11394/4926/Hendriks_jf_mcom_ems_2016.pdf?sequence=1 (accessed 25 July 2020).
Jhinghan, M.L. 2015. Macro economic theory, New Delhi: Vrinda Publications.
Jhinghan, M.L. 2016. Monetary Economics, New Delhi: Vrinda Publications.
Liberto, D. (2019, August 26). Economic forecasting. Investopedia. http://www.investopedia.com/terms/e/economic-forecasting.asp (accessed 26 July 2020)
Lokanathan, V. 2018. A history of economic thought, New Delhi: Vikas Publishing House Private Limited.
Mabasa, N. (2019, July 10). A basic income grant could be the key to uplifting millions out of poverty. Daily Maverick. https://www.dailymaverick.co.za/article/2019-07-10-a-basic-income-grant-could-be-the-key-touplifting-millions-out-of-poverty/ (accessed 25 July 2020).
Mosomi and Wittenberg. (2020). The Labor Market in South Africa 2000-2017 https://wol.iza.org/articles/the-labor-market-in-south-africa/long#:~:text=%2C%20%5B6%5D.-,Wage%20inequality,labor%2C%20thus%20increasing%20wage%20inequality. (accessed 25 July 2020).
Nicholson, W. and Synder, C. 2014. Intermediate Economics and its applications, Boston: Cengage Learning.
Nicoli Nattrass. (1998). Growth, Employment and Economic Policy in South Africa; A critical review https://media.africaportal.org/documents/Growth_employment_and_economic_policy1.pdf (accessed 25 July 2020).
Tisdell, C.A. and Hartley, K. 2008. Microeconomic policy: A new perspective, Massachusetts: Edward Elgar Publishing House.
Tucker, I. 2008. Microeconomics for today, Mason: Cengage Learning.
Remember, at the center of any academic work, lies clarity and evidence. Should you need further assistance, do look up to our Economics Assignment Help
Get It Done! Today
1,212,718Orders
4.9/5Rating
5,063Experts

Highlights
- 21 Step Quality Check
- 2000+ Ph.D Experts
- Live Expert Sessions
- Dedicated App
- Earn while you Learn with us
- Confidentiality Agreement
- Money Back Guarantee
- Customer Feedback
Just Pay for your Assignment
Turnitin Report
$10.00Proofreading and Editing
$9.00Per PageConsultation with Expert
$35.00Per HourLive Session 1-on-1
$40.00Per 30 min.Quality Check
$25.00Total
Free- Let's Start


