- Subject Code : ENGT5112
- University : De Montfort University My Assignment Services is not sponsored or endorsed by this college or university.
- Subject Name : Engineering
Shaping The Sustainable Future of a Country
Table of Contents
Introduction
Social sustainability
Environmental sustainability
Economic sustainability
Introduction
Over the past few years, the World Bank is trying to support economic sustainable development with the following objectives
-
Eradication of poverty by 2030
-
Promotion of shared prosperity
The World Bank wants to attain these goals through these parameters
-
Economic
-
Environmental
-
Social
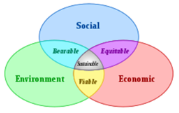
Social Sustainability
Social sustainability refers to well-being of present generations as well as future generation in order develop healthy community. The social sustainability covers wide range of topics that are discussed below. According to WACOSS, Western Australia Council of Social Services, the communities that are socially sustainable exhibit the following characteristics: diverse, equitable, having good quality of life, connected and democratic.
Social sustainable practices include equal human rights, living conditions, health, safety, fair labor, diversity, community engagement, balance between work and life and philanthropy.
Half of the world's population is composed of women and girls. Therefore, gender equality should be basic human right. According to UNICEF, every man and woman have equal rights.
Everyone has the right to work. Everyone has the right to choose employment. Everyone has the right to get paid for work.
Child labor is prohibited throughout the world. It has been seen that child labor has economic damage throughout the world. Children could not get education if they are obliged to work.
Although workers are allowed to work for 35 hours per week, if they want to work more , they are paid for extra hours.
The working place conditions should be according to standards.
Human trafficking is strictly prohibited.
Poverty needs to be addresses if social sustainability is to be attained. According to World Bank, the extreme poverty has decreased rapidly. The definition of extreme poverty is " those who spend less than or equal to $1.90/day''. The number of extreme poor people in 1990 was 1.9 billion while the number of extreme poor people in 2015 was 736 million which implies that they are declining day by day.
Sub-Saharan Africa is the region that is comprised of more poor people as compared to rest of the world. It is forecasted that 9 out of 10 extreme poor people will be lived in Sub-Saharan Africa by 2030.
Environmental Issues and Sustainability
Countries are facing challenges with depletion of natural resources, pollution and degradation of ecosystem. The depletion of natural resources is threatening future growth of the countries.
The pollution and ecosystem degradation has caused water shortages. Water shortages is impacting negatively productivity and health. Majority of countries in the Middle East, Central Asia, North Africa and South Asia are facing considerable water shortages.
Global warming is causing climatic risks. The recent climatic risks are
-
Heat waves
-
Droughts
-
Floods
-
cyclones
-
wildfires
The future climatic risks are
-
Increase in temperature
-
Intense weather
-
Melting of polar caps
-
Failure of crops
-
Epidemics
-
Transformation in ecosystem of earth
In addition to these physical risks, the change in climate can negatively impact forest, agriculture, fisheries, health care and real estate, for instance, floods can damage buildings and droughts can cause failure of crops.
The environmental sustainability can be achieved in following ways
-
Protection of fisheries and livestock's
-
Use of renewable energy sources instead of non-renewable energy sources. Renewable energy sources are solar, wind, geothermal, hydro and biomass. Non-renewable energy sources are coal, oil and gas. Renewable energy sources do not release pollutants to environment and thus provide cleaner and healthier environment. Renewable energy sources are found everywhere in world and they cannot be depleted, however, renewable energy sources will deplete with the passage of time. The cost to tap renewable energy sources is lower as compared to non-renewable energy sources.
-
Plant more trees. Trees prevent noise pollution. Trees clear air borne pollution such carbon monoxide, sulphur dioxide and nitrogen dioxide. They also lowers temperature of air in summer.
-
Use of energy efficient appliances; use L.E.Ds instead of lights In this way, both energy and cost will be saved. Computers use energy when they are in on. Turn off the monitor and ditch when the computer is not in use. To building, stone, concrete or bricks are embedded into ground of the building. The buildings gets cool due to high thermal mass of these materials. The temperatures gets smoothed with time as these materials absorb and release heat slowly, making day time cooler and night time warmer. Unfortunately, if building has little thermal mass, there will be few positive environmental impacts. After embedded ground of the building with concrete, the building leads to high environmental impacts. The use of air conditioner is minimized which results in saving of both energy and cost.
-
To reduce heating effect, tops of roofs are painted with white paint and plants are planted on roofs. These paints have the ability to reflect solar radiation. As compared to conventional paints, these paints can reduce temperatures up to 10o Roofs can also be painted with thermo chromic paints. These paints absorb heat and light in cold and reflect heat and light in warm.
-
The non-roofs surfaces such as terrace are provided with shades.
-
Windows of the building are provided with solar glazing. These solar glazing's keeps sun's heat outside but let day light to enter inside.
-
To minimize fan's use, wind driven natural ventilation is used. Cross-ventilation through corridors is used. Night ventilation is not allowed.
-
Efficient waste management reduces environmental impact and promote sustainability. Reduce, reuse and recycle are the three keywords that can reduce global impact. Conservation of natural resources, reduction of pollution and reduction of carbon foot prints can be achieved through reduce, reuse and recycle. To minimize waste, buy only those products that you need. Excessive packaging should be avoided and recycle things. Prior to throw everything into dustbin, separate your trash and reuse things, for example, kitchen waste can be used in garden. Old clothes and appliances can be used in rebuild and reuse.
Decarbonisation and Sustainable Development
Decarbonisation means eliminations of carbon emissions. Currently, all the industries are facing this issue and it is essential to tackle this issue for climate change.
The world is not meeting the Sustainable Development Goals (SDGs). The IEA’s Sustainable Development Scenario (SDS) delineate that the world can change to fulfill the SDGs.
According to IEA Stated Policies Scenario (STEPS), the world is not on track to attain UN SDGs regarding energy. These goals are
-
To get universal contact to energy
-
To lessen the severe health effects of air pollution
-
To deal with climate change
The SDS is determined to transform the world so that it can follow sustainable Energy Goals (SDGs). It starts with SDG outcomes and what will be required in order to fulfill these goals in cost-effective and realistic way. The Sustainable Development Scenario has been extended to 2050 in the WEO-2019.
Energy production leads to green house gas emissions. The objective of Paris Agreement is to stop the increase in global temperature below 2oC above pre-industrial levels and limit the increase in temperature to 1.5oC above pre-industrial levels.
The Paris Agreement calls addresses balance between sources and sinks in the century's second half.
Economic Development
Economic sustainability is the capability of economy to prop-up economic production. Generally economic goals are defined in terms Gross Domestic Product(GDP) all over the world.
To establish a sustainable economy, it is essential that all sectors of community have to participate. The GDP of various sustainable countries countries are discussed as follows
USA
The United States of America has the world's largest economy. In 2018, the size of the United States economy was $20.58 trillion and it is expected that it will reach $22.32 in 2020.
Real GDP of United States (2019)
|
Component |
Amount (trillions) |
Percent |
|
Personal Consumption |
$13.28 |
70% |
|
Goods |
$4.76 |
25% |
|
Durable Goods |
$1.77 |
9% |
|
Non-durable Goods |
$3.01 |
16% |
|
Services |
$8.56 |
45% |
|
Business Investment |
$3.42 |
18% |
|
Fixed |
$3.34 |
17% |
|
Non-Residential |
$2.74 |
14% |
|
Commercial Real Estate |
$0.54 |
3% |
|
Capital Goods |
$1.27 |
7% |
|
Intellectual (Software) |
$0.97 |
5% |
|
Residential |
$0.59 |
3% |
|
Change in Inventories |
$0.07 |
0% |
|
Net Exports |
($0.95) |
(5%) |
|
Exports |
$2.53 |
13% |
|
Imports |
$3.49 |
18% |
|
Government |
$3.30 |
17% |
|
Federal |
$1.28 |
7% |
|
Defense |
$0.77 |
4% |
|
State and Local |
$2.02 |
10% |
|
TOTAL GDP |
$19.07 |
100% |
China
The China has world's second largest economy.
|
2014 |
2015 |
2016 |
2017 |
2018 |
|
|
Population (million) |
1,368 |
1,375 |
1,383 |
1,390 |
1,395 |
|
GDP per capita (USD) |
7,650 |
7,945 |
8,134 |
8,858 |
9,916 |
|
GDP (USD bn) |
10,464 |
10,922 |
11,247 |
12,313 |
13,837 |
|
Economic Growth (GDP, annual variation in %) |
7.3 |
7.0 |
6.8 |
6.9 |
6.7 |
|
Consumption (annual variation in %) |
8.0 |
7.4 |
8.6 |
6.4 |
9.1 |
|
Investment (annual variation in %) |
7.4 |
7.0 |
6.8 |
5.2 |
4.9 |
|
Industrial Production (annual variation in %) |
8.3 |
6.1 |
6.0 |
6.6 |
6.2 |
|
Retail Sales (annual variation in %) |
12.0 |
10.7 |
10.4 |
10.3 |
9.0 |
|
Unemployment Rate |
4.1 |
4.1 |
4.0 |
3.9 |
3.8 |
|
Fiscal Balance (% of GDP) |
-1.8 |
-3.4 |
-3.8 |
-3.7 |
-4.1 |
|
Public Debt (% of GDP) |
14.9 |
15.5 |
16.1 |
16.2 |
16.3 |
|
Money (annual variation in %) |
12.2 |
13.3 |
11.3 |
8.1 |
8.1 |
|
Inflation Rate (CPI, annual variation in %, eop) |
1.5 |
1.6 |
2.1 |
1.8 |
1.9 |
|
Inflation Rate (CPI, annual variation in %) |
2.0 |
1.4 |
2.0 |
1.6 |
2.1 |
|
Inflation (PPI, annual variation in %) |
-1.9 |
-5.2 |
-1.3 |
6.3 |
3.5 |
|
Policy Interest Rate (%) |
5.60 |
4.30 |
4.30 |
4.30 |
4.31 |
|
Stock Market (annual variation in %) |
52.9 |
9.4 |
-12.3 |
6.6 |
-24.6 |
|
Exchange Rate (vs USD) |
6.21 |
6.49 |
6.95 |
6.51 |
6.88 |
|
Exchange Rate (vs USD, aop) |
6.16 |
6.28 |
6.64 |
6.76 |
6.62 |
|
Current Account (% of GDP) |
2.3 |
2.8 |
1.8 |
1.6 |
0.4 |
|
Current Account Balance (USD bn) |
236 |
304 |
202 |
195 |
49.1 |
|
Trade Balance (USD billion) |
383 |
594 |
510 |
420 |
351 |
|
Exports (USD billion) |
2,342 |
2,273 |
2,098 |
2,263 |
2,487 |
|
Imports (USD billion) |
1,959 |
1,680 |
1,588 |
1,844 |
2,136 |
|
Exports (annual variation in %) |
6.0 |
-2.9 |
-7.7 |
7.9 |
9.9 |
|
Imports (annual variation in %) |
0.5 |
-14.3 |
-5.5 |
16.1 |
15.8 |
|
International Reserves (USD) |
3,899 |
3,406 |
3,098 |
3,236 |
3,168 |
|
External Debt (% of GDP) |
17.0 |
12.7 |
12.6 |
14.3 |
14.2 |
Japan
The third largest economy in the world is of Japan.
|
2014 |
2015 |
2016 |
2017 |
2018 |
|
|
Population (million) |
127 |
127 |
127 |
127 |
126 |
|
GDP per capita (USD) |
38,363 |
34,514 |
38,977 |
38,130 |
39,305 |
|
GDP (USD bn) |
4,877 |
4,383 |
4,949 |
4,833 |
4,972 |
|
Economic Growth (GDP, annual variation in %) |
0.4 |
1.2 |
0.5 |
2.2 |
0.3 |
|
Domestic Demand (annual variation in %) |
0.4 |
0.8 |
-0.1 |
1.6 |
0.3 |
|
Consumption (annual variation in %) |
-0.9 |
-0.2 |
-0.3 |
1.3 |
0.0 |
|
Investment (annual variation in %) |
3.1 |
1.6 |
-0.3 |
3.0 |
0.6 |
|
Exports (G&S, annual variation in %) |
9.3 |
2.9 |
1.7 |
6.8 |
3.4 |
|
Imports (G&S, annual variation in %) |
8.3 |
0.8 |
-1.6 |
3.4 |
3.4 |
|
Industrial Production (annual variation in %) |
1.9 |
-1.1 |
0.0 |
3.1 |
1.1 |
|
Retail Sales (annual variation in %) |
1.7 |
-0.4 |
-0.6 |
1.9 |
1.7 |
|
Unemployment Rate |
3.6 |
3.4 |
3.1 |
2.8 |
2.4 |
|
Fiscal Balance (% of GDP) |
-5.6 |
-3.8 |
-3.7 |
-3.2 |
- |
|
Public Debt (% of GDP) |
236 |
232 |
236 |
235 |
- |
|
Money (annual variation in %) |
3.5 |
3.1 |
3.9 |
3.6 |
2.4 |
|
Inflation Rate (CPI, annual variation in %, eop) |
2.4 |
0.1 |
0.3 |
1.1 |
0.3 |
|
Inflation Rate (CPI, annual variation in %) |
2.8 |
0.8 |
-0.1 |
0.5 |
1.0 |
|
Inflation (PPI, annual variation in %) |
3.2 |
-2.3 |
-3.5 |
2.3 |
2.6 |
|
Policy Interest Rate (%) |
0.10 |
0.10 |
-0.10 |
-0.10 |
-0.10 |
|
Stock Market (annual variation in %) |
7.1 |
9.1 |
0.4 |
19.1 |
-12.1 |
|
Exchange Rate (vs USD) |
119.7 |
120.3 |
116.9 |
112.7 |
109.6 |
|
Exchange Rate (vs USD, aop) |
105.9 |
121.1 |
108.8 |
112.2 |
110.5 |
|
Current Account (% of GDP) |
0.8 |
3.1 |
4.0 |
4.2 |
3.5 |
|
Current Account Balance (USD bn) |
37.1 |
136 |
197 |
201 |
175 |
|
Trade Balance (USD billion) |
-101.3 |
-7.6 |
48.4 |
44.4 |
14.0 |
Germany
Germany has the largest economy is Europe and ranked at fourth largest economy in the world.
|
2014 |
2015 |
2016 |
2017 |
2018 |
|
|
Population (million) |
81.0 |
81.7 |
82.3 |
82.7 |
82.9 |
|
GDP per capita (EUR) |
36,341 |
37,056 |
37,989 |
39,304 |
40,395 |
|
GDP (EUR bn) |
2,943 |
3,027 |
3,134 |
3,245 |
3,344 |
|
Economic Growth (GDP, annual variation in %) |
2.2 |
1.7 |
2.2 |
2.5 |
1.5 |
|
Domestic Demand (annual variation in %) |
1.6 |
1.6 |
3.0 |
2.4 |
2.1 |
|
Consumption (annual variation in %) |
1.0 |
1.9 |
2.3 |
1.3 |
1.3 |
|
Investment (annual variation in %) |
3.9 |
1.8 |
3.8 |
2.5 |
3.5 |
|
Exports (G&S, annual variation in %) |
4.7 |
5.5 |
2.4 |
4.9 |
2.1 |
|
Imports (G&S, annual variation in %) |
3.7 |
5.8 |
4.3 |
5.2 |
3.6 |
|
Industrial Production (annual variation in %) |
1.5 |
0.9 |
1.8 |
3.3 |
1.0 |
|
Retail Sales (annual variation in %) |
1.2 |
3.8 |
2.6 |
2.8 |
1.8 |
|
Unemployment Rate |
6.7 |
6.4 |
6.1 |
5.7 |
5.2 |
|
Fiscal Balance (% of GDP) |
0.6 |
0.9 |
1.2 |
1.2 |
1.9 |
|
Public Debt (% of GDP) |
75.3 |
72.1 |
69.2 |
65.3 |
61.9 |
|
Inflation Rate (CPI, annual variation in %, eop) |
0.2 |
0.2 |
1.5 |
1.4 |
1.6 |
|
Inflation Rate (CPI, annual variation in %) |
0.9 |
0.5 |
0.5 |
1.5 |
1.7 |
|
Inflation (PPI, annual variation in %) |
-1.0 |
-1.9 |
-1.6 |
2.7 |
2.6 |
|
Policy Interest Rate (%) |
- |
- |
- |
- |
- |
|
Stock Market (annual variation in %) |
2.7 |
9.6 |
6.9 |
12.5 |
-18.3 |
|
Exchange Rate (vs USD) |
- |
- |
- |
- |
- |
|
Exchange Rate (vs USD, aop) |
- |
- |
- |
- |
- |
|
Current Account (% of GDP) |
6.9 |
8.5 |
8.4 |
8.0 |
7.4 |
|
Current Account Balance (EUR bn) |
211 |
260 |
265 |
262 |
246 |
|
Trade Balance (EUR billion) |
215 |
242 |
245 |
249 |
231 |
India
The economy of India is growing at faster pace and it has the fifth largest economy in world in 2019.
|
2014 |
2015 |
2016 |
2017 |
2018 |
|
|
Population (million) |
1,266 |
1,283 |
1,300 |
1,317 |
1,334 |
|
GDP per capita (USD) |
1,614 |
1,633 |
1,763 |
2,017 |
2,027 |
|
GDP (USD bn) |
2,044 |
2,096 |
2,291 |
2,657 |
2,704 |
|
Economic Growth (GDP, annual variation in %) |
7.4 |
8.0 |
8.3 |
7.0 |
6.1 |
|
Consumption (annual variation in %) |
6.4 |
7.9 |
8.1 |
7.0 |
7.2 |
|
Investment (annual variation in %) |
2.6 |
6.5 |
8.5 |
7.2 |
9.8 |
|
Industrial Production (annual variation in %) |
4.1 |
3.3 |
4.6 |
4.4 |
3.8 |
|
Public Debt (% of GDP) |
67.8 |
68.8 |
67.7 |
67.8 |
68.1 |
|
Money (annual variation in %) |
10.7 |
11.5 |
6.7 |
21.8 |
14.3 |
|
Inflation Rate (CPI, annual variation in %, eop) |
5.3 |
4.8 |
3.9 |
4.3 |
2.9 |
|
Inflation Rate (CPI, annual variation in %) |
6.0 |
4.9 |
4.5 |
3.6 |
3.4 |
|
Inflation (PPI, annual variation in %) |
1.3 |
-3.6 |
1.8 |
2.9 |
4.3 |
|
Policy Interest Rate (%) |
7.50 |
6.75 |
6.25 |
6.00 |
6.25 |
|
Stock Market (annual variation in %) |
24.9 |
-9.4 |
16.9 |
11.3 |
17.3 |
|
Exchange Rate (vs USD) |
62.29 |
66.25 |
64.86 |
65.11 |
69.19 |
|
Exchange Rate (vs USD, aop) |
61.14 |
65.42 |
67.04 |
64.46 |
69.91 |
|
Current Account (% of GDP) |
-1.4 |
-1.1 |
-0.7 |
-1.8 |
-2.1 |
|
Current Account Balance (USD bn) |
-27.6 |
-22.1 |
-15.2 |
-48.7 |
-57.0 |
|
Trade Balance (USD billion) |
-137.5 |
-117.3 |
-108.9 |
-158.6 |
-182.1 |
|
Exports (USD billion) |
311 |
262 |
275 |
305 |
330 |
|
Imports (USD billion) |
448 |
379 |
384 |
463 |
512 |
|
Exports (annual variation in %) |
-1.2 |
-15.6 |
5.1 |
10.6 |
8.4 |
|
Imports (annual variation in %) |
-0.7 |
-15.3 |
1.3 |
20.5 |
10.6 |
|
International Reserves (USD) |
341 |
356 |
373 |
421 |
414 |
|
External Debt (% of GDP) |
23.2 |
23.1 |
20.6 |
19.9 |
20.1 |
References
[1] Decarbonizing development to secure a sustainable future. (2020). Retrieved 28 February 2020, from https://www.greengrowthknowledge.org/blog/decarbonizing-development-secure-sustainable-future
[2] The number of extremely poor people continues to rise in Sub-Saharan Africa. (2020). Retrieved 28 February 2020, from https://blogs.worldbank.org/opendata/number-extremely-poor-people-continues-rise-sub-saharan-africa
[3] Decarbonisation. (2020). Retrieved 28 February 2020, from https://www.rssb.co.uk/en/Research-and-Technology/Sustainability/Decarbonisation
[4] Sustainable poverty reduction and green growth. (2020). Retrieved 28 February 2020, from https://blogs.worldbank.org/developmenttalk/sustainable-poverty-reduction-and-green-growth
[5] Staff, E. (2020). 10 Things You Should Do To Promote Sustainability | Environmental Professionals Network. Retrieved 28 February 2020, from http://environmentalprofessionalsnetwork.com/10-things-you-should-do-to-promote-sustainability/
[6] (2020). Retrieved 28 February 2020, from https://sciencing.com/renewable-vs-nonrenewable-energy-resources-12071170.html
[7] Top 10 Advantages of Planting Trees - Listovative. (2020). Retrieved 28 February 2020, from https://listovative.com/top-10-advantages-of-planting-trees/
[8] Solutions, A. (2020). What is Social Sustainability? | Definition of Social Sustainability | ADEC ESG Solutions. Retrieved 28 February 2020, from https://www.esg.adec-innovations.com/about-us/faqs/what-is-social-sustainability/
[9] Definition of Economic Sustainability. (2020). Retrieved 28 February 2020, from https://www.thwink.org/sustain/glossary/EconomicSustainability.htm
Remember, at the center of any academic work, lies clarity and evidence. Should you need further assistance, do look up to our Engineering Assignment Help
Get It Done! Today
1,212,718Orders
4.9/5Rating
5,063Experts

Highlights
- 21 Step Quality Check
- 2000+ Ph.D Experts
- Live Expert Sessions
- Dedicated App
- Earn while you Learn with us
- Confidentiality Agreement
- Money Back Guarantee
- Customer Feedback
Just Pay for your Assignment
Turnitin Report
$10.00Proofreading and Editing
$9.00Per PageConsultation with Expert
$35.00Per HourLive Session 1-on-1
$40.00Per 30 min.Quality Check
$25.00Total
Free- Let's Start


