- Subject Name : Epidemiology
Physical Activity and Incident Depression
Question One
DALYs= 1.72%
YLD= 5.05%
The burden due to depressive symptoms by depression patients on the populations in the year 2017 was huge as compared to sum of years of productive life lost due to depressive symptoms and years of potential life lost due to premature mortality caused by depression. This is because of high depression prevalence that cause more burden to the population while the lost years of health life in depressive patients were few.
Question Two
Descriptive studies
Descriptive studies are designed to provide information concerning the current status of a situation or a problem. They do not provide a definite answer nor does not disprove a hypothesis because they employ observational methods rather than quantitative methods of analysis.
Question Three
The authors used the term “association” because there are various other factors that might differ and lead to different results. It therefore defines that higher levels of physical activity would decrease risks for later depression but does not hold constant in every case due to confounding variables.
Question Four
|
Population |
Studies that include evaluating participants, of all ages, who are free from depression or depressive symptoms at baseline. Participants with incident depressive disorders along with anxiety disorders. People diagnosed with incident depression including those with depressive symptoms. Studies that include participants of the exposed cohort and ascertainment of the exposure |
|
Intervention (exposure) |
Depression assessment methods including screening instruments, physician diagnosis of major depression, assessment of major depression using either semi structured or structured diagnostic instruments and adjustment of potential confounders. |
|
Comparator |
Studies comparing the incident depression in the highest physical activity level group and the lowest physical activity level group or reference group |
|
Outcome |
.Adequate assessment of effects of physical activity on depression and depressive symptoms, adequate follow up time and adequacy of follow up. |
|
Study type |
Meta-analysis of Observational Studies in Epidemiology and Preferred Reporting Items for Systematic Reviews and Meta-Analyses. |
Question Five
Minimize the risk of selection Bias
The outcome is not known at the baseline during establishment of exposure status. The subjects of the comparison group
Comprehensive and clear temporal sequence
Subjects are known to be disease free at the beginning or at the baseline of the observation and it clearly depicts temporal sequence between exposure and outcome.
Question six
Adequacy of follow up
Studies less than one year are likely to have bias errors due to inadequate follow up in that there is no complete follow up and subjects are lost to follow up. Assessment of the follow up of the exposed and non-exposed cohorts might be insufficient and hence does some subjects are not accounted for. The follow up rate might be too low or its description is unclear (Schuch et. al., 2018.
Question seven
Recall bias has been used differently by the authors the results from the analysis showed that physical activity decreased the risk of developing depression while actually in recall bias, participants are systematically more or less likely to recall and relate information regarding their outcome dependent on exposure to physical activities.
Non- differential errors
The error bias goes towards the null. The research analysis involved use of odds ratio, adjusted odds ratio and risk ratio and so exposure status is incorrect for people with depressive symptoms and for participants without depression.
Question Eight
Adjusted pooled odds ratio have higher values than crude pooled odds ratio because crude odd ratios were obtained by studies that considered the effect of only predictor variable that is one independent variable while adjusted odds ratio were obtained by inclusion of more variables in the analysis.
I would choose adjusted pooled odds ratio analysis because it involved various different variables to determine the effect of physical activity on the depression and depressive symptoms. Therefore, more confounding variables were considered in adjusted odds ratio analysis (Smoller, 2019).
Question Nine
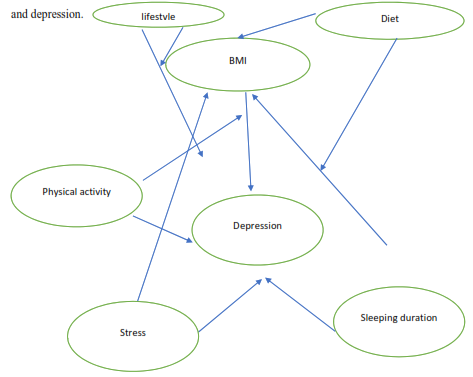
Results from various studies concerning the association of body mass index and depression are conflicting with other studies giving positive association while others give a negative association. Depression might lead to changing eating patterns and reduced physical activity and therefore cause obesity (Schuch et. al., 2018. On the other hand, obesity may cause negative body image and thus depression. Both underweight and overweight are associated with depression and so understanding the four BMI categories plays a vital role in association of BMI and depression.
Question Ten
Loss of follow up is likely to cause selection bias. The studies considered for this research required to have had at least one year follow up. At the enrolment selection bias will not occur because the outcome has not yet occurred. However, it can be difficult to track participants when the observation period is long thus loss of follow up and hence introduction of selection bias on both exposure status and outcome status.
Question Eleven
Baseline information which was used in by the studies to facilitate tracking of the subjects. This information includes phone numbers, emails addresses and physical addresses.
Question Twelve
The systematic review protocol was not registered
Question Thirteen
There is PRISMA Flow diagram in the online data supplement.
Question Fourteen
Based on figure 1. Forest Plot of Studies Examining the Association Between Physical Activity and Incident Depression, odds ratio is reasonably consistent.
Question Fifteen
Heterogeneity measure in this research involved calculating waiting sum of squared differences between pooled effects across studies and individual studies with the weights being obtained from pooled data. A random effects meta-analysis was carried out since research involved various studies hence a significant and substantial heterogeneity ( Schuch et. al., 2018.
Question Sixteen
The funnel plot does not agree with their conclusion that there was publication bias. Based on the funnel plot its shape is symmetrical. The base of the funnel has small studies with large effect estimate variability while it’s top is narrow thus it consists of large studies with small estimate variability (Smooler, 2019).
Question Seventeen
Higher physical activity levels are associated with decreased odds of developing future depression for people of all ages across geographical regions around the world. From this systematic review its clear that higher levels of physical activity are consistently associated with a lower odds of developing future depression. People diagnosed with depression are at greater risk of reduced physical activity in that they are less active than the general population. Physical activity does not only reduce the risk of depression but also can help in combating the mental health epidemic. Regular and consistent physical activity has significant impacts in improving depressive symptoms. Physical activity and depression has strong association in that people engaging in lower levels of physical activity have high risk of depression that those who engage in higher levels of physical activity (Schuch et. al., 2018.
Question Eighteen
Exposure: Physical Activity and Outcome is Depression
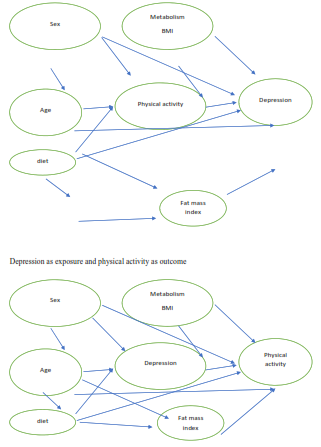
Question Nineteen
They found evidence of a protective causal relationship between physical activity and major depression. Using bidirectional MR, the research found evidence of only one direction of the relationship between physical activity and depression. Physical activity demonstrated a potential causal relationship with depression. On the other hand, depression does not have such causal relationship with the physical activity (Choi et. al., 2019).
Question Twenty
Measuring physical activity through self-report may be affected by the factors such as mood, cognitive and states biases that are related to the mental health and therefore it makes it difficult to conclude if the assessment reports are true or they are just subject to errors of common liability. Self –report measures needs to be validated by results from objective measures (Choi et. al., 2019).
Question Twenty-One
Enhancing physical activity is a significant and effective prevention strategy for depression. Physical activity has potential causal association with depression. It reduces risk of depression and therefore physical activity promotion I management, prevention and treatment of depression in general population, or to vulnerable groups such as people facing depressogenic exposures, adolescents, violence-exposed individuals and stress related jobs should be promoted (Choi et. al., 2019).
Question Twenty-Two
Inclusion and exclusion criteria was set for selecting relevant data for the review process. The study evaluated participants of all who were free from depressive symptoms at baseline. The study adopted a prospective design with at least one year. Physical activity was evaluated by use of self-report questionnaire while incident depression was measured by depression screening instruments. Where the data was not available, respective authors were conducted for the data to be included in the meta-analysis (Schuch et. al., 2018). This generalization process ensured enhanced validity, reliability and likelihood that analysis can apply to both similar and dissimilar groups.
Question Twenty-Three
A further study can be done to assess the effect of different physical activity types on subsequent risk of depression. The study should focus on specific group such as adolescents with certain range of age. A group who can participate in all set types of physical activities to be evaluated. The participants with depressive symptoms are engaged in regular and monitored various physical activity and followed up after two years. They are then examined at regular intervals and re-assessment done to establish their depression status based on the type of physical activity they were engaged in. Statistical analysis approaches such as linear and logistic regression are then used to test prospective associations between physical activity and depression outcomes (Wassink et. al., 2018).
References
Chekroud, A. M. (2019). A Mendelian Randomization Approach for Assessing the Relationship Between Physical Activity and Depression. JAMA psychiatry, 76(4), 361-362.
Choi, K. W., Chen, C. Y., Stein, M. B., Klimentidis, Y. C., Wang, M. J., Koenen, K. C., & Smoller, J. W. (2019). Assessment of bidirectional relationships between physical activity and depression among adults: a 2-sample mendelian randomization study. JAMA psychiatry, 76(4), 399-408.
Schuch, F. B., Vancampfort, D., Firth, J., Rosenbaum, S., Ward, P. B., Silva, E. S., ... & Fleck, M. P. (2018). Physical activity and incident depression: a meta-analysis of prospective cohort studies. American Journal of Psychiatry, 175(7), 631-648.
Wassink-Vossen, S., Collard, R. M., Hiles, S. A., Voshaar, R. O., & Naarding, P. (2018). The reciprocal relationship between physical activity and depression: Does age matter?. European Psychiatry, 51, 9-15.
Remember, at the center of any academic work, lies clarity and evidence. Should you need further assistance, do look up to our Epidemiology Assignment Help
Get It Done! Today
1,212,718Orders
4.9/5Rating
5,063Experts

Highlights
- 21 Step Quality Check
- 2000+ Ph.D Experts
- Live Expert Sessions
- Dedicated App
- Earn while you Learn with us
- Confidentiality Agreement
- Money Back Guarantee
- Customer Feedback
Just Pay for your Assignment
Turnitin Report
$10.00Proofreading and Editing
$9.00Per PageConsultation with Expert
$35.00Per HourLive Session 1-on-1
$40.00Per 30 min.Quality Check
$25.00Total
Free- Let's Start


