- Subject Name : Biological science
Laboratory Report on Gene Expression and Methylation of DNA
Abstract of Laboratory Report
The aim of conducting this laboratory experiment was to try and understand the expression and the relation between gene expression and methylation of DNA and how it is affected by the variation in the DNA sequences. This is because gene variation can lead to the development of some codes that the body will receive and manufacture abnormal cells that can be termed as cancerous cells such as in the case of lymphomas. The methodology provides the methods on how and what to do to evaluate and get appropriate results to this goal. This laboratory test was done on qualitative and quantitative research using materials from journals and reports of other experiments conducted concerning this report. The findings in this paper highlight the conditions associated with gene and DNA alteration.
Introduction to Laboratory Report
In this report two oncogenes were explored, T-Cell Acute Lymphocytic Leukemia (TALL) a protein-coding gene, associated with cancer-causing diseases such as Lymphoblastic Leukemia and Lymphocytic Leukemia and the Cadherin gene (CDH1), associated with lung epithelial. In this experiment genetic variation is explored through gene expression and DNA methylation of these two genes to analyze if it is an effect of the mutation. From this, it was hypothesized that differences in the expression of TAL1 or CDH1 are due to differences in DNA methylation and/or variation in genetic sequence.
It was found that CDH1 and TAL1 were more expressed in cancer-causing cells relative to non-cancer causing, in which sample two for both oncogenes expressed higher levels of the genes CDH1 and TAL1. Where there was a difference in gene expression there was a difference in DNA methylation from enhancers, in which MSRE4 in CDH1 and MSRE5 in TAL1 showed signs of DNA demethylation from both sample two. Although the results differed for the nanpore sequencing between oncogenes, where a 12bp insertion was discovered where there were high peaks of histone acetylation for MSRE5 in TAL1 sample two. CDH1 showed no insertions or deletions; however, there were high levels of histone acetylation in MSRE4, where altering haplotypes was also discovered between CDH1 samples.
Methodology of Laboratory Report
Gene Expression of TAL1 and CDH1
To begin with, cDNA was synthesized from RNA, a total volume of 20 microliters was made up of 4 ul of RNA, (final concentration 5ng/ul), 4ul TransAmp buffer, 1 ul reverse transcriptase, and remaining water. A quantitative polymerase chain reaction (qPCR) was prepared using ABI 7500 FAST to analyze the expression of TAL1 and CDH1, relative to NFYB used as a reference gene. SensiFAST SYBR green, forward and reverse primers (0.2uM) were the components used to make up a total volume of 10ul, including 2ul of cDNA and water to make up the final volume. After the completion of polymerase activation, denaturation, and collection of fluorescence, the data was normalized respective to NFYB where an average relative fold difference was calculated.
MSRE (methylation-sensitive Restriction Endonuclease) assay – DNA methylation
Three reactions were set up containing genomic DNA (gDNA) digested with Hpall or Mspl and undigested no enzyme as a control. The following components made up a final volume of 15ul; 4ul (100ng) of gDNA, 1ul of the enzyme (Mspl or Hpall), 1.5ul of restriction endonuclease buffer, and 8.5ul water to make up final volume. The undigested treatment contained 9.5ul of water. DNA was digested for one hour at 37 degrees Celsius, and heat inactivation for fifteen minutes at 95 degrees Celsius. Quantitative PCR (QPCR) was set up to amplify two specific regions of CDH1 and TAL1 gene using different primers (MSRE3 and MSRE4 for CDH1 and MSRE4 and MSRE5 for TAL1), gDNA samples were diluted to a concentration of 5ng/ul, 2ul was added to 5ul of SensiFAST SYBR Green, 1ul (0.2uM) of each forward and reverse primer and 1ul of water.
Nanopore DNA Sequencing ligation-mediated PCR library
PCR is used to isolate and amplify specific sequences within CDH1 (1610bp) and TAL1 (2032) genes, first the DNA was amplified in a master mix with the following components; 3ul of gDNA (1.5ng/ul), 25ul of traq mix, 5ul (0.5uM) forward and reverse primer mix and 12ul water to make up a final volume of 50ul. An enzyme end-repair mix was made up with 30ul of DNA fragments, 5ul of 10x end repair reaction mix, 2.5ul end repair enzyme mix, and 12.5ul water. These components allowed blunting and phosphorylation of DNA, after incubating for 10 minutes at 20 degrees Celsius.
A spin column was used to purify the DNA blunt-end. Ligation of sequencing adaptors was completed at room temperature, a master-mix contained the following components; 10ul (100ng) PCR amplicon, 1ul (0.75pmoles/100ng) sequencing adaptor, 4ul rapid ligation buffer, 0.2ul T4 DNA ligase, and 3.8ul water. Finally, nanopore DNA amplification was completed with a master-mix containing 5ul (1:100 dilution) PCR amplicon, 25ul 2x traq mix, 5ul (0.5uM) adaptor PCR primer and 15ul water to make a final volume of 50ul.
Results of Laboratory Report
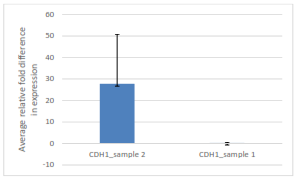
Figure 1: Comparison of average relative fold difference in gene expression of CDH1 (LEPI) samples one and two from qPCR Assay.
The average relative fold difference was calculated from the CT values associated with the amount of fluorescence, where the data was normalized from a twofold difference relative to a reference sample (NFYB). The higher the average relative fold differences the higher the level of gene expression. This figure shows a huge increase in CDH1 expression in sample two relative to sample one, indicating that there is a higher level of CDH1 gene expressed in sample two relative to sample one.
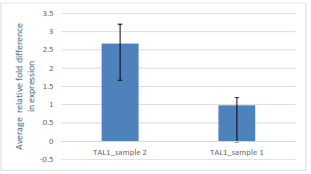
Figure 2: Comparison of average relative fold difference in gene expression of TAL1 sample one and two from qPCR Assay.
This figure expresses a higher average relative fold difference in TAL1 sample two relative to sample one, suggesting there is a higher level of the TAL1 gene expressed in sample two relative to sample one.
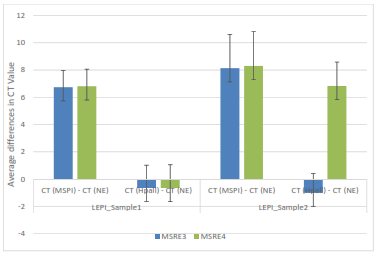
Figure 3: The average differences in CT values between control (no enzyme), Mspl, and Hpall for LEPI samples one and two and their corresponding primers MSRE3 and MSRE4.
It is seen in this figure that both primers MSRE3 and MSRE4 for LEPI sample one show methylation, due to high values for Mspl minus no enzyme and low values for Hpall minus no enzyme. Regarding LEPI sample two, the average differences in CT values for Mspl minus no enzyme are high suggesting DNA methylation for both primers. However, in sample two, MSRE4 has a high average difference in CT value for Hpall minus no enzyme, suggesting DNA demethylation.
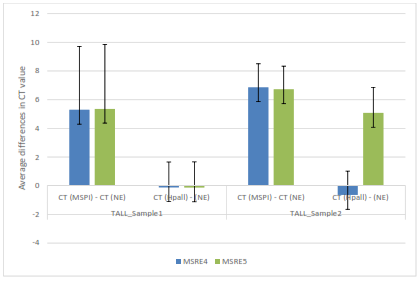
Figure 4: Average differences in CT values between control (no enzyme), Mspl and Hpall for TALL samples one and two and their corresponding primers MSRE4 and MSRE5
There are higher average differences in CT values for Mspl than Hpall minus no enzyme for both primers MSRE4 and MSRE5 in TALL sample one, suggesting DNA methylation. In TALL sample two the average differences in CT values are high for Hpall in MSRE5 relative to MSRE4 suggesting DNA demethylation.
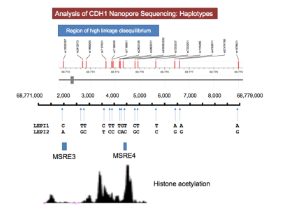
Figure 5: CDH1 Nanopore Sequencing MSRE3 and MSRE4 histone acetylation peaks and CDH1 samples one and two haplotypes (Downloaded from Graham Jones).
MSRE3 and MSRE4 show different levels of histone acetylation due to the different sized peaks. LEPI samples one and two exhibit alternate haplotypes and different combinations of alleles in high linkage disequilibrium. There is no evidence of any cancer-causing mutations, insertions, or deletions associated with this CDH1 sample.
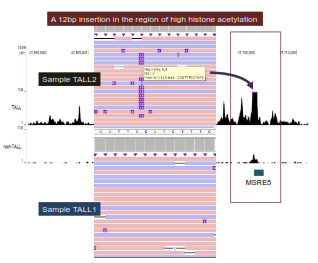
Figure 6.12: Base-Pair insertion in the region of high histone acetylation in sample two of the TALL gene (Downloaded from Graham Jones).
A rare mutation is revealed in the figure where a 12 base-pair insertion lies in a region of high histone acetylation in sample two of TALL. There was no evidence of any insertions in sample one of TALL. TAL1 is more expressed in the leukemia cell where the figure exhibits larger peaks of histone acetylation.
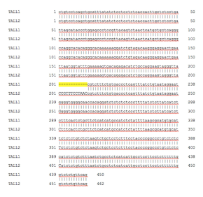
Figure 7: Part of the DNA sequence of the TAL1 amplicon where a 12bp insertion exists (Downloaded from Graham Jones).
Highlighted in yellow is the section of the TAL1 DNA sequence which contains the 12 base-pair insertions at the region of high histone acetylation, this is a visual representation of a mutation.
Discussion to analyze the genetic control of gene expression of CDH1 and TAL1
This report aims to analyze the genetic control of gene expression of CDH1 and TAL1, analyzing if we see changes in gene expression and DNA methylation are there ultimately changes in DNA sequence where mutations could be present. The results conveyed a difference in gene expression between samples of CDH1 and TAL1; where sample two for both genes expressed a higher level of CDH1 and TAL1 relative to sample one. Following this sample, two of TAL1 showed DNA demethylation in MSRE5 where a 12bp insertion was highlighted in a high region of histone acetylation. There were no insertions found in CDH1 samples, however, MSRE4 conveyed high levels of histone acetylation, and the samples displayed altering haplotypes.
Gene expression is controlled by genetic switches called enhancers; MSRE4 and MSRE5 were used as regulatory DNA in this experiment to analyze specific parts of a T-cell acute lymphoblastic leukemia cell (TALL). Figure 2 exhibits differences in gene expression between samples of TALL where there is a higher level of TAL1 expressed in sample two relative to sample one, from this it can be hypothesized that perhaps sample two is a leukemic cell. Because there is a change in gene expression between samples, figure 4 exhibits DNA demethylation in MSRE5 TALL sample two, where high levels of TAL1 was expressed.
High levels of gene expression are associated with high histone acetylation; figure 6 reveals a large peak of histone acetylation in MSRE5 where a 12bp insertion was identified from the nanopore DNA sequencing results highlighted in figure 7. Similarly, Mansour 2014 discusses somatic mutations that are developed from regulatory DNA, where a super-enhancer is identified in high regions of histone acetylation.
From these results, it can be hypothesized that mutations are associated with high levels of gene expression. (Vaharautio, 2014) states that “…..changes in gene expression affect noncoding regions of the genome causing mutations…” Finally, it can be concluded that perhaps the TALL samples are biologically different because we only saw changes between samples and not from different regions of the gene i.e. MSRE4 and MSRE5.
Figure one displays CDH1 highly expressed in sample two relative to sample one and following this in figure three, MSRE4 in CDH1 of sample two shows low DNA demethylation. Similarly, Bock 2012 also discovered that where there was an increase in DNA methylation there was a decrease in gene expression in adult stem cells, confirming that gene expression is controlled by epigenetic switches. MSRE4 displayed high levels of histone acetylation (figure 5) where CDH1 samples differed in haplotypes, it can be hypothesized that the different combinations of alleles are associated with different levels of gene expression. (Pinheiro, 2009), states that “….when both CDH1 alleles were present relative to monoallelic CDH1, there was higher CDH1 expression….” From this information, high gene expression can be correlated with varying combinations of alleles and therefore conclude that perhaps the two CDH1 samples were biologically different.
Both CDH1 alleles from cancer-free individuals displayed equivalent expression levels, whereas monoallelic CDH1 expression or high allelic expression imbalance (AI) was present in 80% of CDH1 mutant and 70.6% (n512) of CDH1-negative HDGC probands. Germline deletions and promoter hypermethylation were found in 25% of pro-bands displaying high CDH1 AI. No particular haplotype was found to be associated with CDH1 high AI. Germline CDH1 AI is highly frequent among CDH1 but was not seen in cancer-free individuals. This implicates the CDH1 locus in the majority of mutation-negative HDGC families.
Conclusion on Laboratory Report
This report concluded that gene expression is correlated with insertion mutations regarding TAL1, and perhaps the TALL samples are biologically different as only changes were discovered between samples and not from regions of the genes. The results from CDH1 conclude that high levels of gene expression are associated with low DNA demethylation and changes in gene expression are correlated with different combinations of alleles, respective to a vitro study, perhaps the two CDH1 samples were biologically different.
References for Laboratory Report
Bock, C. Beerman, I. Lien, WH. Smith, ZD. Gu, H. Boyle, P. Gnirke, A. Fuchs, E. Rossi, DJ & Meissner, A. 2012, 'DNA methylation dynamic during in vivo; Differentiation of blood and skin stem cells', Molecular Cell Resource, vol. 47, no. 4, pp. 633-647, viewed 17 April 2020, Plumx Metrics Online, DOI https://doi.org/10.1016/j.molcel.2012.06.019.
Mansour, MR. Abraham, BJ. Anders, L. Berezovskaya, A. Gutierrez, A. Durbin, AD. Etchin, J. Lawton, L. Sallan, SE. Silverman, LB. Loh, LL. Hunger, SP. Sandra, T. Young, RA & Look, AT 2014, ‘An ocogenic super-enhancer formed through somatic mutation of a noncoding intergenic element’, Oncogene Regulation, vol. 346, no. 6215, pp. 1373-1377, viewed 12 April 2020, Science Magazine Online, DOI 10.1126/science.1259037.
Pinheiro, H. Bordeira-Carrico, R. Seixas, S. Carvalho, J. Senz, J. Oliveira, P. Inacio, P. Gusmao, L. Rocha, J. Huntsman, D. Seruca, R & Oliveria, C 2009, ‘Allele-specific CDH1 downregulation and hereditary diffuse gastric cancer’, Human Molecular Genetics, vol. 19, no. 5, pp. 943-952, viewed 15 April 2020, PubMed Online, DOI 10.1093/hmg/ddp537.
Vaharautio, A & Taipale, J 2014, ‘Cancer by super-enhancer; Tiny changes in our genomes can enhance oncogene expression and contribute to tumorigenesis’, Cancer, vol.346, no. 6215, pp. 1291-1292, viewed 13 April 2020, Science Magazine Online, DOI 10.1126/science.aaa3247.
Remember, at the center of any academic work, lies clarity and evidence. Should you need further assistance, do look up to our Biology Assignment Help
Get It Done! Today
1,212,718Orders
4.9/5Rating
5,063Experts

Highlights
- 21 Step Quality Check
- 2000+ Ph.D Experts
- Live Expert Sessions
- Dedicated App
- Earn while you Learn with us
- Confidentiality Agreement
- Money Back Guarantee
- Customer Feedback
Just Pay for your Assignment
Turnitin Report
$10.00Proofreading and Editing
$9.00Per PageConsultation with Expert
$35.00Per HourLive Session 1-on-1
$40.00Per 30 min.Quality Check
$25.00Total
Free- Let's Start


