- Subject Name : IT Computer Science
1. Use Case Introduction: Connected Claims Processing
This discussion seeks to identify a use case linked to the insurance sector. The use case here is about the connected claims processing. Advanced algorithms have allowed insurance claims to become automated quite dramatically. This in process allows insurance firms to level their efficiency and accuracy very dramatically as well. The end result has further been a reduction in the amount of processing time of claims from days to hours and finally minutes. Through algorithms, information catch innovation using technologies such as IoT sensors that have since replaced the manual techniques. Consequently, firms may trigger cases triage in a similar manner of fixing administration demands. The assessment of viability of claims has since become way simpler as an undertaking for insurance firms (Martínez-Plumed, et al., 2019).
Business Propositions
This section collects the major phases of CRISP-DM followed by the generic tasks and outcomes. The empirical case would be solved by following and sticking to each of these phase and task. The extra theory and model utilized in the empirical study has since been explained under each subsection.
|
Business Understanding |
Data Understanding |
Data Preparation |
Modelling |
Evaluation |
|
Determining business objectives Assessing situations Determining data mining goals Producing project plans |
Collecting initial data Describing data Exploring data Verifying data quality |
Selecting data Cleaning data Constructing data Integrating data Formatting data |
Selecting modelling techniques Generating test designs Building models Assessing models |
Evaluating results Reviewing processes Determining the next steps |
2. Business Understanding
This phase begins with comprehending the project objectives and needs from a business angle. In this case, weekly claim on unemployment insurance expresses industry knowledge straight into problem definition. The main objective of this project is linked to the development of particular objectives.
3. Data Understanding
This data relates to unemployment insurance weekly claims that face the present economy in California. The data has been utilized in assessing the economic state of unemployment trends where the initial claims tend to measure emerging unemployment for a long span of time.
Visualization the Correlation Between Important Variables
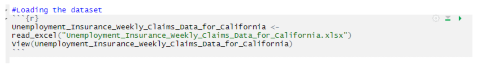
To load the dataset to RStudio for analysis, the code used is as shown below:
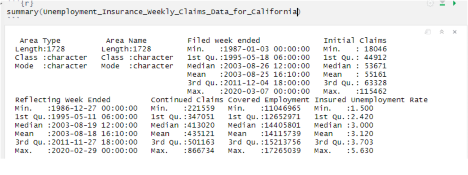
The level of data correlation is seen through measures of central tendencies such as mean, mode and median and other correlation measures such as standard deviation and interquartile ranges.
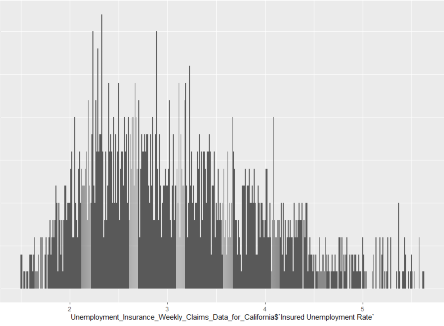
Plot 1: Bar plot of Insured Unemployment Rate
4. Data Preparation
The data preparation phase involves every activity needed for transforming the initial raw dataset into the final dataset in preparation for the modelling phase. This phase of data preparation differ for each project. In this case, the main task include the selection of various attributes, data cleaning, solving data quality issues and construction of newer attributes.
5. Modeling
According to existing research, the performances of data mining models relies on the prevailing problem. There is no particular data mining technique that offers an ultimate solution to every single problem. The objective of selecting the model for this study is directly correlated to the expected outcomes. For this reason, the performance of data mining techniques has since been evaluated as per a particular task. This technique has been adopted and applied throughout the analysis phase of this dataset. Various parameters too have since been calibrated with the objective of finding optimal values. Given this trend, particular input allows for the next phase which is data preparation (Martínez-Plumed, et al., 2019).
Selected Algorithm
Decision trees have various algorithm that supports its performance. This include CART, C5.0, ID3 and Hunt algorithm. Observations associated with a node are trained to assist in the analysis phase of the class labels. Recursive definitions then follow where the algorithm occurs with every observation belonging to a similar class and terminal node. Various observations made here would belong to an extra class attribute where the test conditions aim at partitioning these results into smaller subsets. Child nodes are also constructed for every outcome under such test conditions. The next phase would involve the observations passed to these children in line with the existing outcomes. This algorithm is then recursively made applicable to every child node.
Why This Algorithm
Decision tree has several advantages unlike other techniques that produces output. One likely demerit of this tool is the scalability and efficiency issues linked to it. More particularly, there could be some inefficiencies of existing algorithms.
6. Evaluation
CRISP-DM methodology has been widely utilized here just like with other financial sectors meant for data mining and for predictive analytics kind of projects. CRISP-DM methodology has become applicable in real world business case here where UI weekly insurance claims have been brought under analysis for targeted marketing given the internal and open data. This extensive study has managed to pursue various splits in analyzing this kind of data. Various feature selection approaches and algorithms work hand in hand in contributing towards the success of this analysis (Martínez-Plumed, et al., 2019).
References
Martínez-Plumed, F., Contreras-Ochando, L., Ferri, C., Orallo, J. H., Kull, M., Lachiche, N., ... & Flach, P. A. (2019). CRISP-DM Twenty Years Later: From Data Mining Processes to Data Science Trajectories. IEEE Transactions on Knowledge and Data Engineering.
Unemployment Insurance Weekly Claims Data for California. (2019, September 17).
Remember, at the center of any academic work, lies clarity and evidence. Should you need further assistance, do look up to our Computer Science Assignment Help
Get It Done! Today
1,212,718Orders
4.9/5Rating
5,063Experts

Highlights
- 21 Step Quality Check
- 2000+ Ph.D Experts
- Live Expert Sessions
- Dedicated App
- Earn while you Learn with us
- Confidentiality Agreement
- Money Back Guarantee
- Customer Feedback
Just Pay for your Assignment
Turnitin Report
$10.00Proofreading and Editing
$9.00Per PageConsultation with Expert
$35.00Per HourLive Session 1-on-1
$40.00Per 30 min.Quality Check
$25.00Total
Free- Let's Start


