- Subject Code : MAE-203
- University : Deakin University My Assignment Services is not sponsored or endorsed by this college or university.
- Subject Name : Economics
Australian Economics Assignment Sample
Question 1(a)
Monthly Cash Rate From August 1990 to January 2020
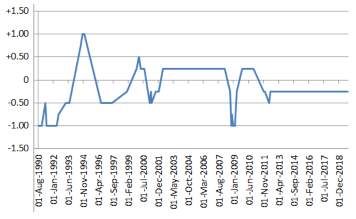
Source: World Bank
The above line graph shows the trend of cash rate in Australia from August 1990 to January 2020. From the graph, it can be seen that the level of cash rate is more in 2020 than the level of cash rate in 1990. There was a steep fall in the cash rate in the period 1992-1994. The Reserve Bank of Australia loosened its policy during this period to combat the recession during the period. Also, during the period of financial crisis from 2007-2009, there was a steep fall in the cash rate. This drop in the cash rate was to support the economy from getting into recession. Therefore, to pump money in the economy, the RBA had lowered the cash rate so that the commercial banks can give more cheaper loans to the people. After 2013, there was no substantial increase or decrease in the cash rate.
Question 1(b)
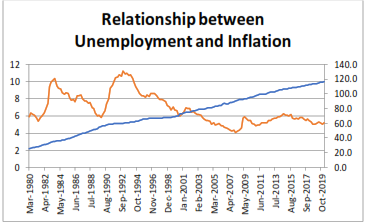
Source: RBI
Generally, in the short run, the relationship between inflation and unemployment is negative. This is the finding by A.W. Phillips which is also known as Phillips curve. This says that as the economy grows, there is increase in the money supply which leads to high inflation in the economy (Swastika & Masih, 2016). Due to the economic growth, there are more jobs in the market which further implies less unemployment. From the line charts, we can see that the blue line which shows inflation is rising over the years from 1980 to 2020. Whereas, the orange line, which shows unemployment is falling over the years. Therefore, according to the claim of Phillips curve, there is an inverse relationship between inflation and unemployment.
Question 2.
The outbreak of the deadly corona virus that has started from China is affecting all other countries worldwide. The impact of this pandemic was heavily felt by the Australian economy and also to its growth.
It is projected that there are many sectors which are going to be hampered due to this outbreak of corona virus. The main sectors are education, exports and tourism. Also, it is very well known that the biggest trading partner of Australia is China. Australia is considered as a proxy for China in the whole world. Most of consumer products come from China (Bailey & West, 2020). By this pandemic, China shutdown to the world will affect the gross domestic product of Australia. This will have a negative impact on the GDP growth and will do damage to the economy.
Starting from the exports, major exports of Australia includes iron ore, metallurgical and thermal coal, and liquefied natural gas and energy products. China consumes most of these products and is considered as the biggest consumer. From the data of the Australian Bureau of Statistics, it is shown that at the end of 2019, the country exported about 14 billion Australian dollars value of merchandise to China. This accounts for about 34% of total exports in this month. This is a very huge number and fraction of exports of Australia. China uses about one third of exports of Australia. This includes the huge ones. Iron ore and coal are the most important ones.
It is observed that the demand of coal and iron ore is declining as industries in China are remaining idle because of this pandemic and restrictions by the government to open any factories. According to a prediction, the economy of Australia will decline by 0.1 percent in the first quarter before any rebounding (McKibbin & Fernando, 2020).
There was a warning which also included Australian resource producers (including BHP). As the assessment was made about the virus' impact on the outlook, there was a warning about the business uncertainties in the upcoming future. Not only China, but the health of the population of border Asia region is also an important thing for the country.
Also, education sector will also be affected as Chinese students account for 0.6% of Australia’s GDP. Many universities of Australia will also be badly affected. If the virus is not going to end, there will be loss of revenue and cash reserves to the universities due to restriction to the foreign students to enter the country.
The tourism sector is also greatly hit with the outbreak of the virus. People came from different countries to visit Australia. Especially, China was the main source of income in the tourist sector because many people from China visited Australia. Due to this virus, ban on the travel will have an immediate impact on the Australia’s economy.
The expenditure-output model shows that there is an interrelationship between aggregate expenditure and output of the economy as both affects each other. The 45 degree line shows those points where output is equal to aggregate expenditure. This is the equilibrium points A and B as shown in the figure.
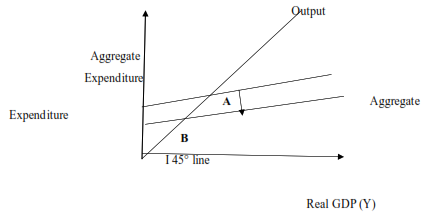
The major adverse impact of virus would be on household spending, employment , trade and investment. This all will lead to a fall in the aggregate expenditure and the line of aggregate expenditure will shift downwards. Thus, the point of equilibrium will move from point A to point B. Therefore, the real output will also fall along with the aggregate expenditure.
Question 3.
The Australian bushfire began from September 2019. As on 9 March 2020, it was estimated that 18.6 million hectares of land was burnt. Also, 59,000 of the buildings along with 2800 homes were destroyed. Many millions of animals were killed. The air quality index was deteriorated.
It is projected that these fires could cripple the consumer confidence of the population of Australia which will further increase the possibility of rate cut (Wittwer, 2020). Also, it will harm the economy with an increase in air pollution. The main industries or sectors which will have a direct impact of fires are farming and tourism.
It is said that bushfires will lead to around a 0.4% hit to GDP followed by the policies to recover the economy from this big damage (Eastin, 2017). But it is expected that the consumer spending and tourism sector will take time to recover from this hit. The major problem is the lack of consumer confidence which was already there due to the slowdown in the growth and higher unemployment in the economy.
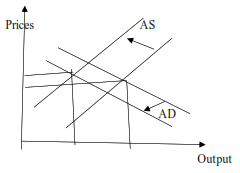
Bushfires will create recessionary gap in an Australian economy. The bushfires in Australia would also create stagflation as aggregate supply will shift to left. In this case real GDP will be less than potential. Moreover, the aggregate demand will also shift to the left. This is because of the lost confidence of the consumers. Thus, both AD and AS will shift to the left. The output will fall by a great quantity (Rogers et al., 2017). The prices will rise. This is due to the shortage in supply. An inflationary gap will be created.
For the stimulation of the economy, government should take effective measures. Both monetary and fiscal measures are required. Monetary measures like decrease in the bank rate, repo rate, reverse repo rate or expansionary open market operations should be done. This is to instil money supply in the economy. Due to shortage of demand and lack of confidence go government should take measures to increase the money supply in the market to further increase the demand of goods by the people (Ulubaşoğlu et al., 2019). In the short run, this will lead to increase in the demand and output in the market. But in the long run, there will be rise in the prices and inflation can occur.
Given the worse situation of the economy, policies are required to boost the economy. Policies should be taken to increase the income but avoiding the rise in prices. Therefore, only monetary policy cannot stimulate the economy. Fiscal policies are also required with the monetary policy to increase the aggregate demand. Broad fiscal policies like cut in the taxes and broad investment allowances can be used as policy measure. In the short run, monetary policy like cut in the cash rate can help to boost the economy (Szczerbowicz, 2011). Whereas, steps should be taken by the government like government purchases and spending on bridges, roads, buildings which will further lead to employment and increase in the purchasing power of the people. This will stimulate the economy in the long run.
References
Bailey, N. W., & West, D. (2020). Are the COVID19 restrictions really worth the cost? A comparison of estimated mortality in Australia from COVID19 and economic recession. arXiv preprint arXiv:2005.03491.
Eastin, J. (2017). Conflict Calamities: Natural Disasters and the CPP-NPA. Kasarinlan: Philippine Journal of Third World Studies, 32(1, 2), 109-138.
McKibbin, W., & Fernando, R. (2020). 3 The economic impact of COVID-19. Economics in the Time of COVID-19, 45.
Rogers, A. A., Gibson, F. L., Florec, V., Hailu, A., & Pannell, D. J. (2017, September). Including the intangible benefits of bushfire mitigation in economic analyses: a ‘Value Tool’for informed decision making. In AFAC17 conference proceedings (pp. 4-7).
Swastika, P., & Masih, M. (2016). Do interest rate and inflation affect unemployment? evidence from Australia. Retrieved from https://mpra.ub.uni-muenchen.de/100067/
Szczerbowicz, U. (2011). Are unconventional monetary policies effective?. LUISS Guido Carli and Sciences Po Working Paper, ed. First Last, 335-405.
Ulubaşoğlu, M. A., Rahman, M. H., Önder, Y. K., Chen, Y., & Rajabifard, A. (2019). Floods, bushfires and sectoral economic output in Australia, 1978–2014. Economic record, 95(308), 58-80.
Wittwer, G. (2020). The 2019-20 Australian Economic Crisis Induced by Bushfires and COVID-19 from the Perspective of Grape and Wine Sectors. Retrieved from http://vuir.vu.edu.au/40403/1/g-299.pdf
Remember, at the center of any academic work, lies clarity and evidence. Should you need further assistance, do look up to our Economics Assignment Help
Get It Done! Today
1,212,718Orders
4.9/5Rating
5,063Experts

Highlights
- 21 Step Quality Check
- 2000+ Ph.D Experts
- Live Expert Sessions
- Dedicated App
- Earn while you Learn with us
- Confidentiality Agreement
- Money Back Guarantee
- Customer Feedback
Just Pay for your Assignment
Turnitin Report
$10.00Proofreading and Editing
$9.00Per PageConsultation with Expert
$35.00Per HourLive Session 1-on-1
$40.00Per 30 min.Quality Check
$25.00Total
Free- Let's Start


