- Subject Code : RH1007
- Subject Name : Data Analysis
Case Study: Immigration Wages
Table of Contents
Introduction.
Part 1.
Part 2.
Part 3.
Part 4.
Part 5.
Part 6.
Part 7.
Part 8.
Conclusion.
References.
Introduction
The assessment is designed to study the analysis of immigrants and the wages they are getting on an hourly basis based on their education level. The sample data obtained will give a brief overview of the description of the data and statistical learning. The results would draw on the nature of the dataset, the types of variables used. Hypothesis testing will give a clear view to analyse the plausibility of the results attained on the immigration wages.
As a manager of Ruby Red Shoes, the sample data will help the CEO to learn on the immigrant employees and the differences in their wages based on their education level. The education level is divided into three groups – one who has attained a bachelor's degree and higher, second is who has attained education till high school and the third is the one who has not studied till high school. The report will further examine the variation in results of wages through descriptive statistics and frequency distribution. Moreover, the probability for a specific interval of wages can even be devised with analysis while making overall recommendations to the CEO on the results.
Part 1- A Type of Variables Used in The Excel Database File Immigrant Wages:
The type of variables used are known as continuous variables where there is no range of values and the values are infinite (Kestenbaum 2019). The variables are numerical in nature as wages are paid as per the employee competency. As per Fernandes et al. (2019), the continuous variables are also known as quantitative variables and in quantitative variables, wages of immigrant employees follow a ratio scale of measurement.
- Immigrant wages = continuous variable (quantitative); Category = Ratio scale
The ratio scale of measurement follows the characteristics of an interval scale that analyses data using the arithmetic average. The ratio scale is even seen in height, weight and length which help the researcher to differentiate between relative magnitudes of variables (Burkholder et al.2019).
Part 2- Data Set Sample Cross-Sectional or Time Series:
The data collected for the study is cross-sectional in nature and not time series because of time series data analyses the data over a period of time (or in years) (Epskamp et al. 2018). Cross-sectional data has several variables but is examined at the same point in time (Bird, Gao and Yeung 2017). Based on the dataset, the data has three variables and several wages of different participants are given. The wages are collected based on participant's education level.
Part 3- Complete Descriptive Statistics:
The descriptive statistics table can be given as:
|
Bachelor's Degree or higher |
High School ($) |
No High School ($) |
|
|
Mean |
22.95966667 |
12.261 |
10.46066667 |
|
Standard Error |
0.650441492 |
0.648458535 |
0.432521592 |
|
Median |
22.36 |
11.84 |
10.495 |
|
Mode |
21.16067 |
9.85 |
10.56367 |
|
Standard Deviation |
3.562614773 |
3.551753671 |
2.369018323 |
|
Sample Variance |
12.69222402 |
12.61495414 |
5.612247816 |
|
Kurtosis |
-0.381488524 |
0.6763741 |
0.653190829 |
|
Skewness |
0.34622644 |
0.885383288 |
-0.10065302 |
|
Range |
13.68 |
15.17 |
11.35 |
|
Minimum |
16.85 |
6.5 |
4.62 |
|
Maximum |
30.53 |
21.67 |
15.97 |
|
Sum |
688.79 |
367.83 |
313.82 |
|
Count |
30 |
30 |
30 |
|
Confidence Level (95.0%) |
1.330302219 |
1.326246617 |
0.88460598 |
The descriptive statistics show that employees with a bachelor's degree have higher wages based on the mean followed by high school and at last, is no high school. This shows that education plays a major role in the wages of immigrant employees. The maximum variation in data is shown in wages of employees with a bachelor's degree or higher and high school. This is because every employee has a different capability to perform a task. As a result, the deviations are high on these two categories and least with no high school education.
The maximum and minimum wages of employees even vary such as the minimum wage of a non-high school employee is $4.62 whereas that of a bachelor's degree is $16.85 which is almost a 4 times increase. The range values are higher for employees with high school education. This must because some employees must have gained experience prior and have landed on to a good pay scale whereas others may be fresher employees. Also, there are other categories like experience, level of performance and handling work burden that could explain the huge variation in range values.
Part 4- Complete Frequency Table and Then Histogram:
The frequency distribution based on the class interval values on different education levels is given as:
- Bachelor’s degree or higher
|
Class Interval |
Frequency |
Relative Frequency/ probability |
Relative %age |
Cumulative Percentage |
|
15-18 |
3 |
0.100 |
10.00% |
10.00% |
|
18-21 |
4 |
0.133 |
13.33% |
23.33% |
|
21-24 |
14 |
0.467 |
46.67% |
70.00% |
|
24-27 |
3 |
0.100 |
10.00% |
80.00% |
|
27-30 |
5 |
0.167 |
16.67% |
96.67% |
|
30-33 |
1 |
0.033 |
3.33% |
100.00% |
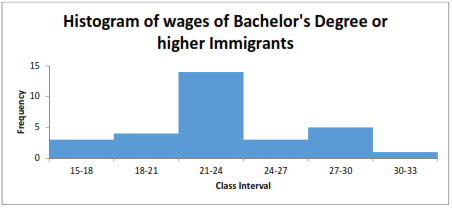
The table given on Bachelor’s Degree immigrant wages shows that the data is normally distributed because the mean is centrally located whereas median and mode are near to the mean showing normal distribution. The maximum number of immigrants has wages in $21-$24 followed by a class interval of $27- $30. On the other hand, the least number of immigrant’s wages are in the group of $15 - $18.
- High School
|
Class Interval |
Frequency |
Relative Frequency/ probability |
Relative %age |
Cumulative Percentage |
|
4--8 |
2 |
0.067 |
6.67% |
6.67% |
|
8--11 |
9 |
0.300 |
30.00% |
36.67% |
|
11--14 |
13 |
0.433 |
43.33% |
80.00% |
|
14--17 |
2 |
0.067 |
6.67% |
86.67% |
|
17--20 |
3 |
0.100 |
10.00% |
96.67% |
|
20-23 |
1 |
0.033 |
3.33% |
100.00% |
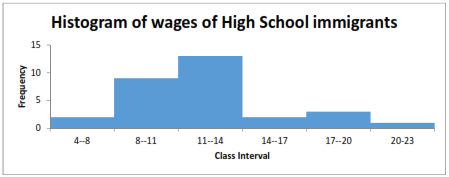
The table given on High School immigrant wages shows that the data is not normally distributed because the mean is not centrally located as mean is greater than median and mode. As the mean is greater than the median and mode then the data is positively skewed. The maximum number of immigrants has wages in $11-$14 followed by a class interval of $8- $110. On the other hand, the least number of immigrant’s wages are in the group of $20 - $23. This shows that the wages are more to the lesser side as per the data and specifically some immigrant employees have higher wages.
- No High School
|
Class Interval |
Frequency |
Relative Frequency/ probability |
Relative %age |
Cumulative Percentage |
|
4.5-7.5 |
2 |
0.067 |
6.67% |
6.67% |
|
7.5-10.5 |
13 |
0.433 |
43.33% |
50.00% |
|
10.513.5 |
13 |
0.433 |
43.33% |
93.33% |
|
13.5-16.5 |
2 |
0.067 |
6.67% |
100.00% |
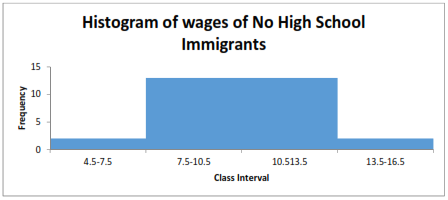
The table given on No High School immigrant wages shows that the data is normally distributed because the mean is centrally located whereas median and mode are near to the mean showing normal distribution. The maximum number of immigrants have wages in $7.5-$13.5. On the other hand, the least number of immigrant’s wages are in the group of $4.5 - $7.5 and $13.5- $16.5. This shows that wages are evenly distributed for no high school immigrant employees.
Part 5- The Probability that The Wage of A High School Immigrant:
- Probability (wage of a high school immigrant earns between $11-$14) = 13/30 = 0.433
Part 6- The Probability that The Wage of A Bachelor Degree Immigrant:
- Probability (wage of a Bachelor Degree immigrant earns between $27-$30) = 5/30 = 0.167
Part 7- The Probability that The Average Immigrant Employee Earns:
Hypothesized mean (X) = $12
Sample Mean (µ) = $1.5
- Probability(average immigrant employee earns less than $12 per hour) = 0.5
Part 8- Recommendations to The CEO:
Based on the analysis, the recommendations that can be made to the CEO are:
- There are other variables that could help in analysing the data and the proportion of wages given along with the education level.
- For generalized results, more employees need to be undertaken in the study based on their wages and education level.
- A higher degree other than Bachelor’s degree could help in segregating the data further.
- The probability defined shows normally distributed results for two categories and not for the high school level.
Conclusion
To conclude, it can be said that the results show that immigrant employees with high education levels are granted higher wages than employees with no high school education even. Also, the bachelor's degree or higher and no high school education shows that the data is normally distributed amongst the sample data depicting that a set range of wages has been decided for employees in these categories whereas, with high school education, the wages are widely dispersed depicting not a normal distribution. Hence, education level does play a major role in deciding the wages of immigrant employees in terms of probability figures
References
Bird, R., Gao, X. and Yeung, D. 2017. Time-series and cross-sectional momentum strategies under alternative implementation strategies. Australian Journal of Management, 42(2), pp.230-251.
Burkholder, G.J., Cox, K.A., Crawford, L.M. and Hitchcock, J.H. eds. 2019. Research Design and Methods: An Applied Guide for the Scholar-Practitioner. SAGE Publications, Incorporated.
Epskamp, S., Waldorp, L.J., Mõttus, R. and Borsboom, D. 2018. The Gaussian graphical model in cross-sectional and time-series data. Multivariate Behavioral Research, 53(4), pp.453-480.
Fernandes, A., Malaquias, C., Figueiredo, D., da Rocha, E. and Lins, R. 2019. Why quantitative variables should not be recorded as categorical. Journal of Applied Mathematics and Physics, 7(07), p.1519.
Kestenbaum, B. 2019. Summary measures in statistics. In Epidemiology and Biostatistics (pp. 187-196). Springer, Cham.
Remember, at the center of any academic work, lies clarity and evidence. Should you need further assistance, do look up to our Data Analysis Assignment Help
Get It Done! Today
1,212,718Orders
4.9/5Rating
5,063Experts

Highlights
- 21 Step Quality Check
- 2000+ Ph.D Experts
- Live Expert Sessions
- Dedicated App
- Earn while you Learn with us
- Confidentiality Agreement
- Money Back Guarantee
- Customer Feedback
Just Pay for your Assignment
Turnitin Report
$10.00Proofreading and Editing
$9.00Per PageConsultation with Expert
$35.00Per HourLive Session 1-on-1
$40.00Per 30 min.Quality Check
$25.00Total
Free- Let's Start


